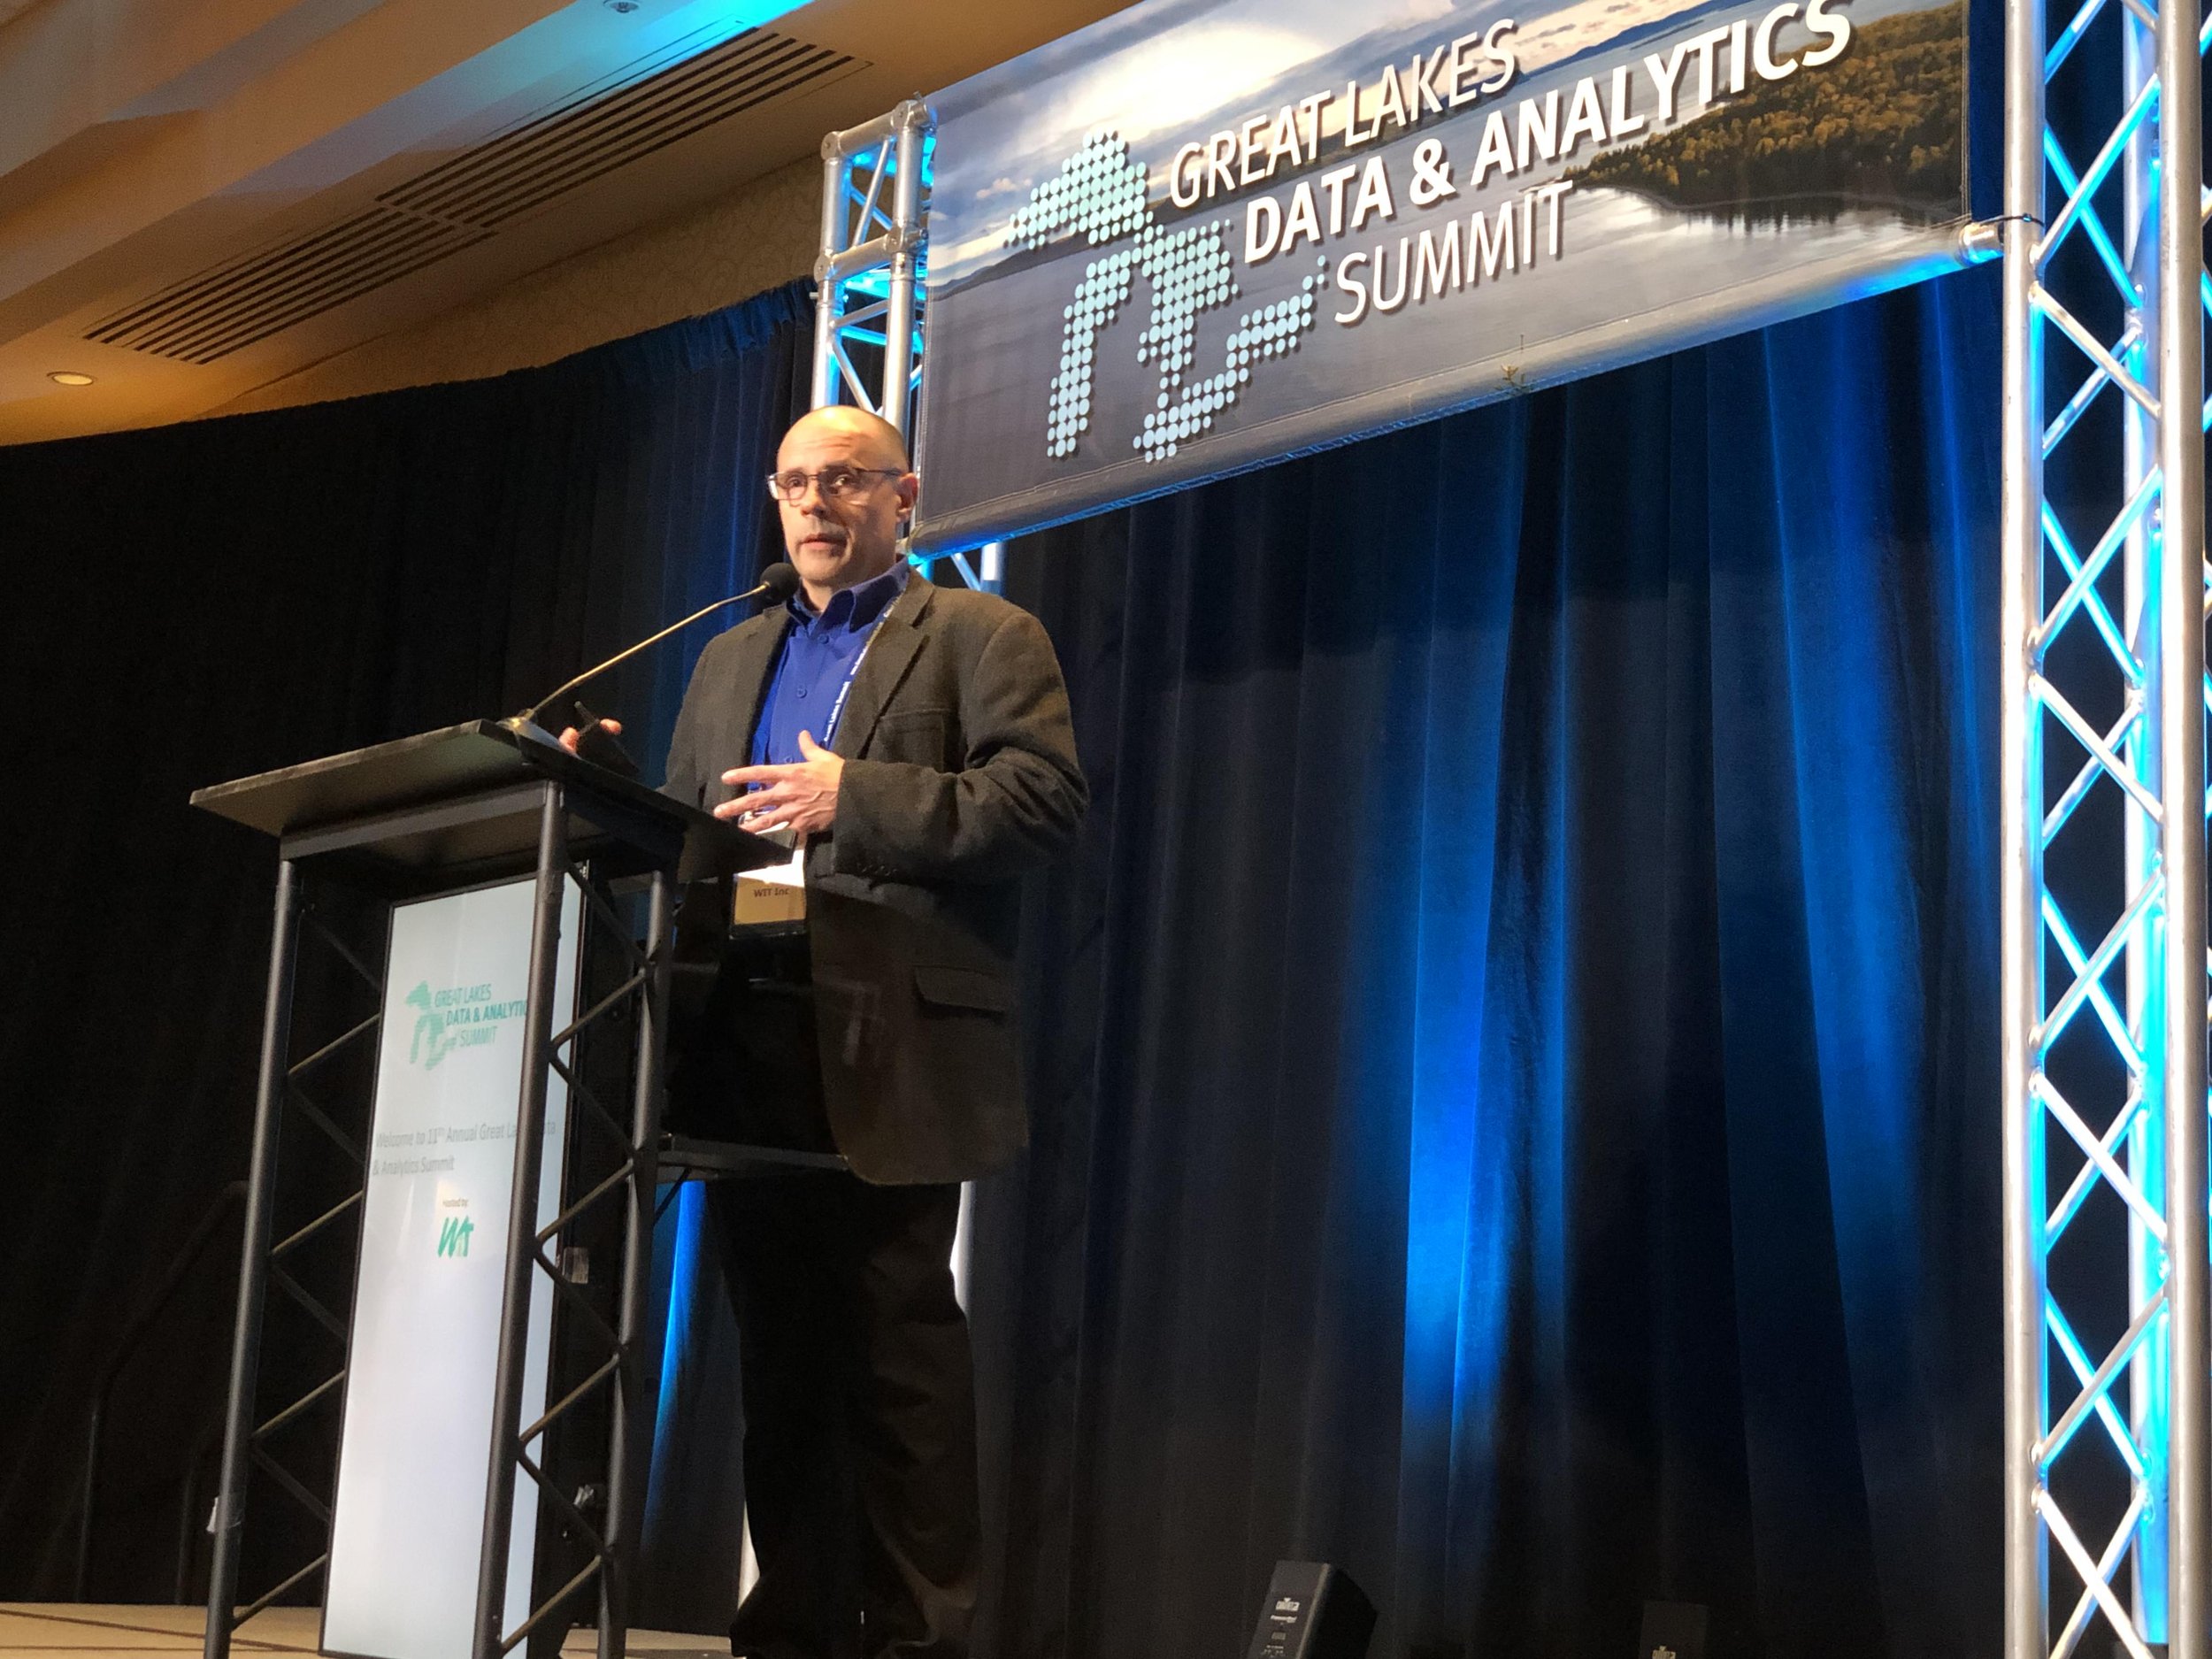
2023 Great Lakes Data & Analytics Summit
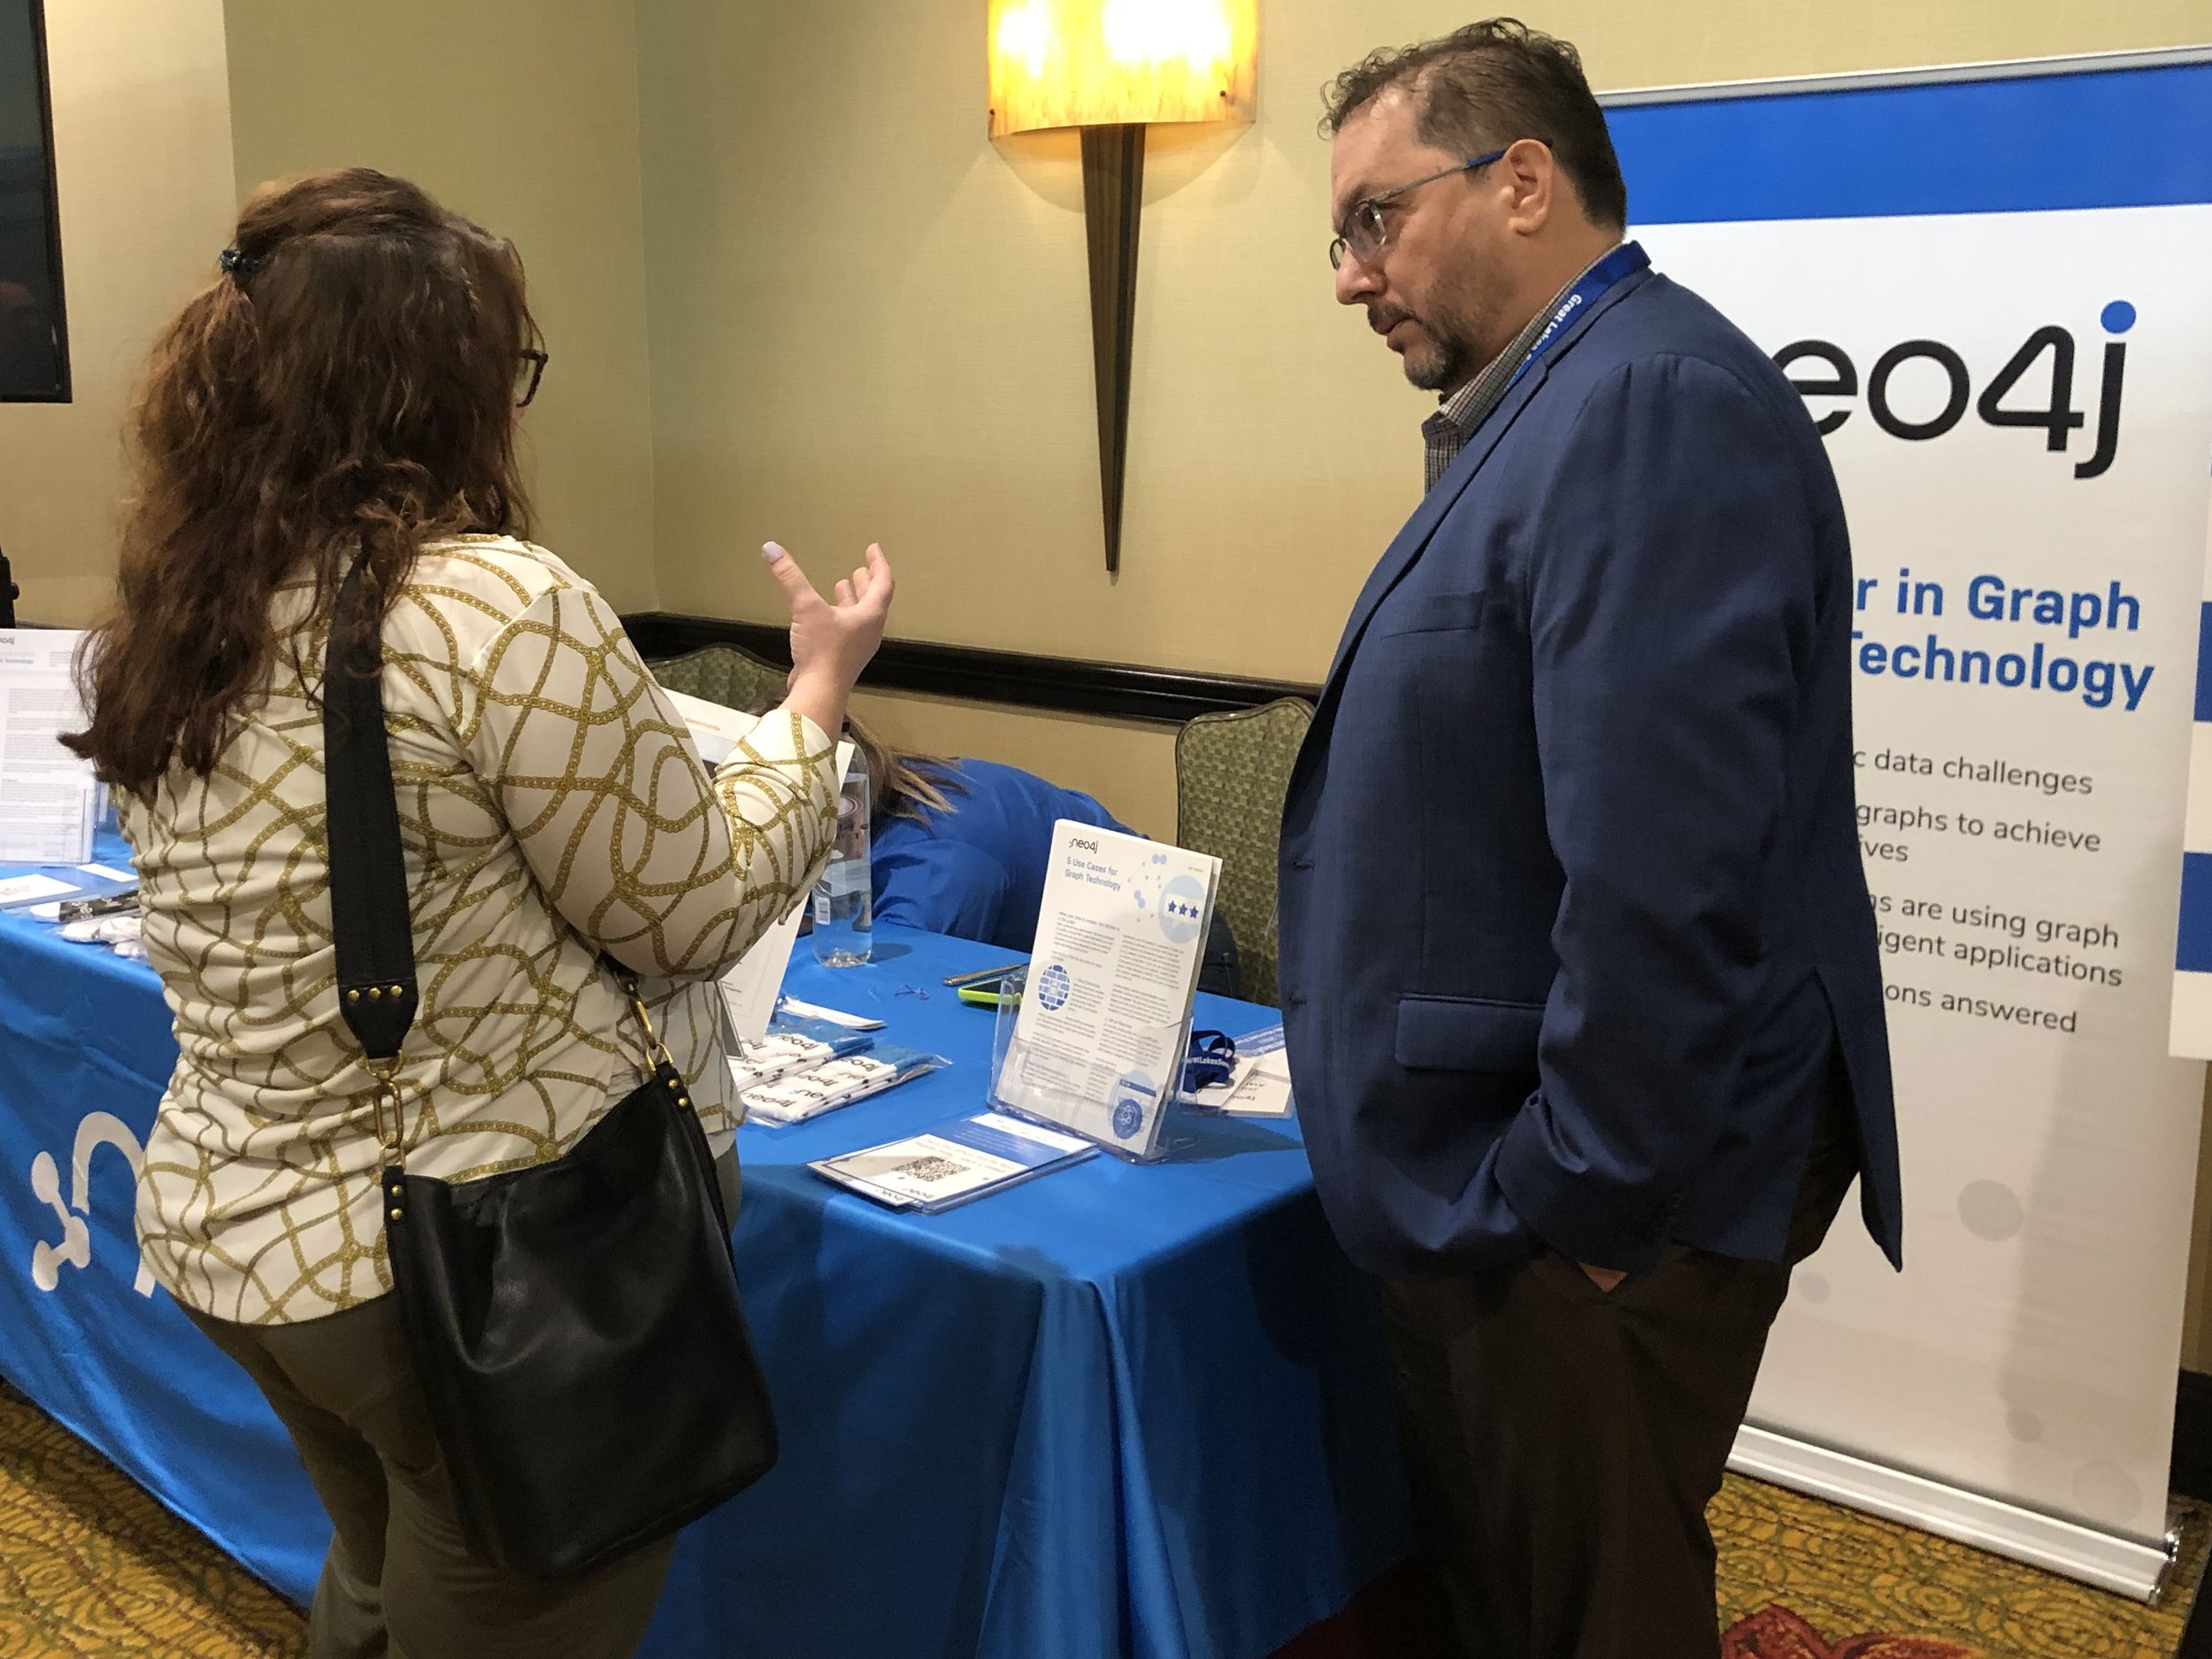
The Great Lakes Data & Analytics Summit is a one-day event for analytics, IT, and business professionals that includes keynotes from industry experts, case study sessions, vendor software demonstrations, hands-on workshops, and plenty of networking opportunities. Attendees will learn about the latest analytics software, best practices, and success stories to help them capitalize on data and analytics strategy, data governance, and extracting business value out of your data assets.
Thursday, April 27, 2023 | 8:00am - 5:00PM
Troy Marriott | 200 W. Big Beaver Rd, Troy, MI
Thank you for attending!
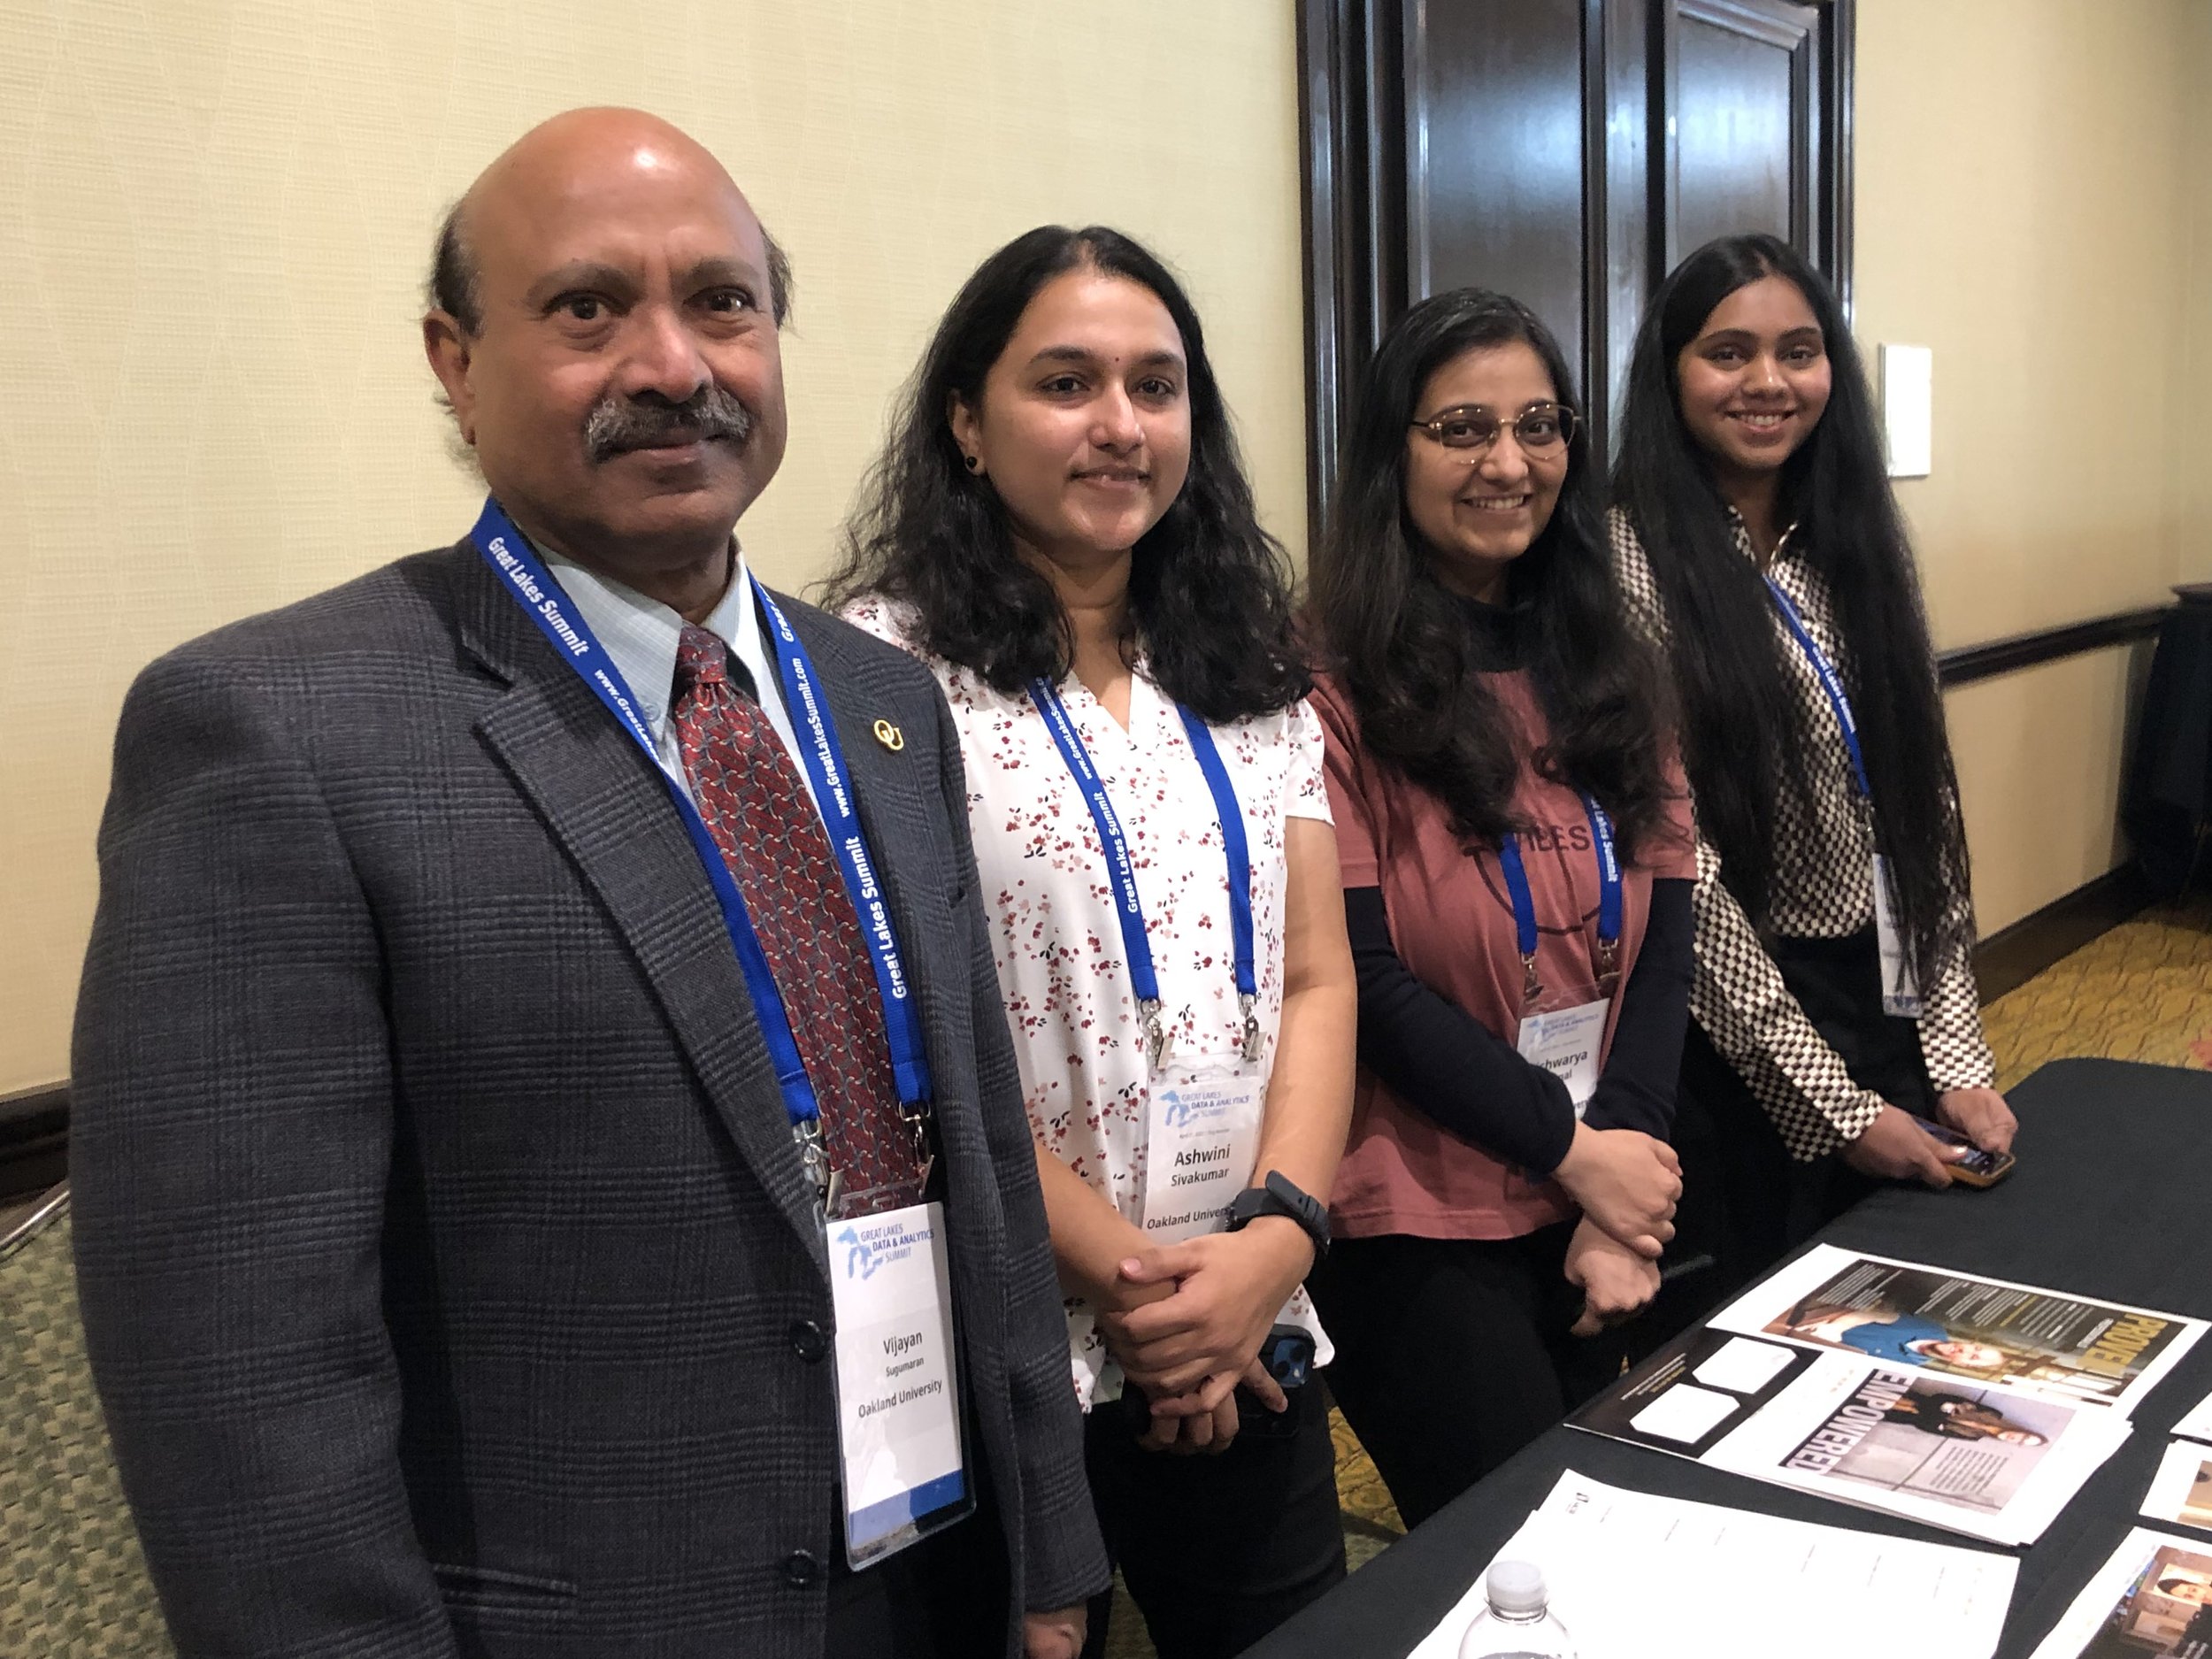
Thank you to all our speakers, sponsors, and attendees for making the 11th annual Great Lakes Data & Analytics Summit another successful event! It was great to see everyone who came out, and truly feel that in-person events are back for good. We had a great line-up of speakers that brought some interesting insights from their work in the analytics field and beyond.
>> You can access session recordings and session materials under each session description
Agenda
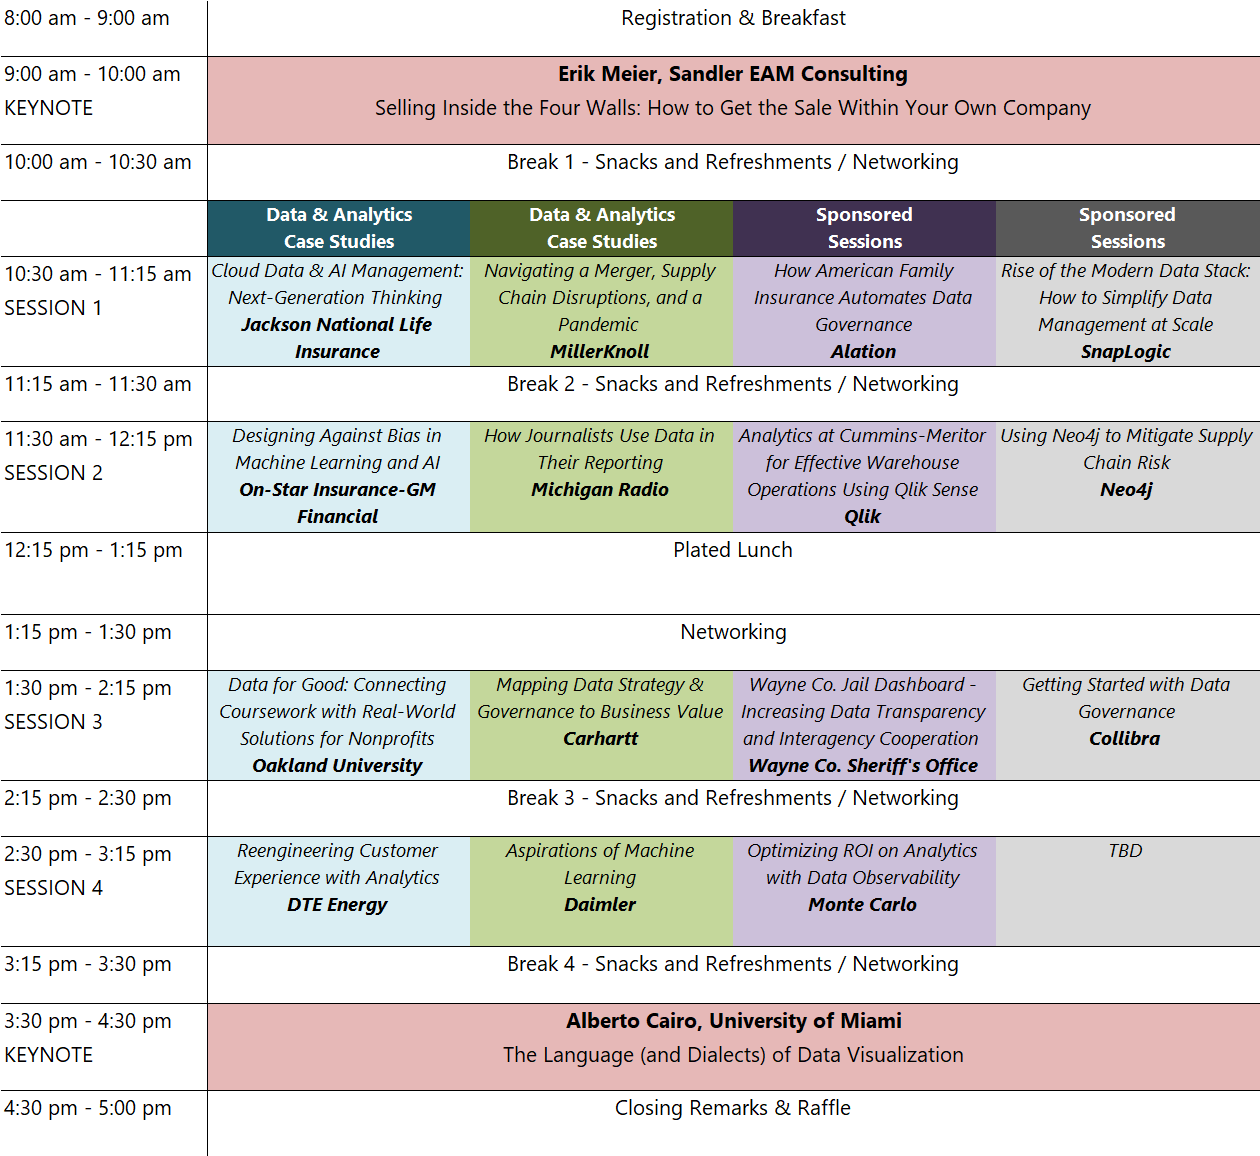
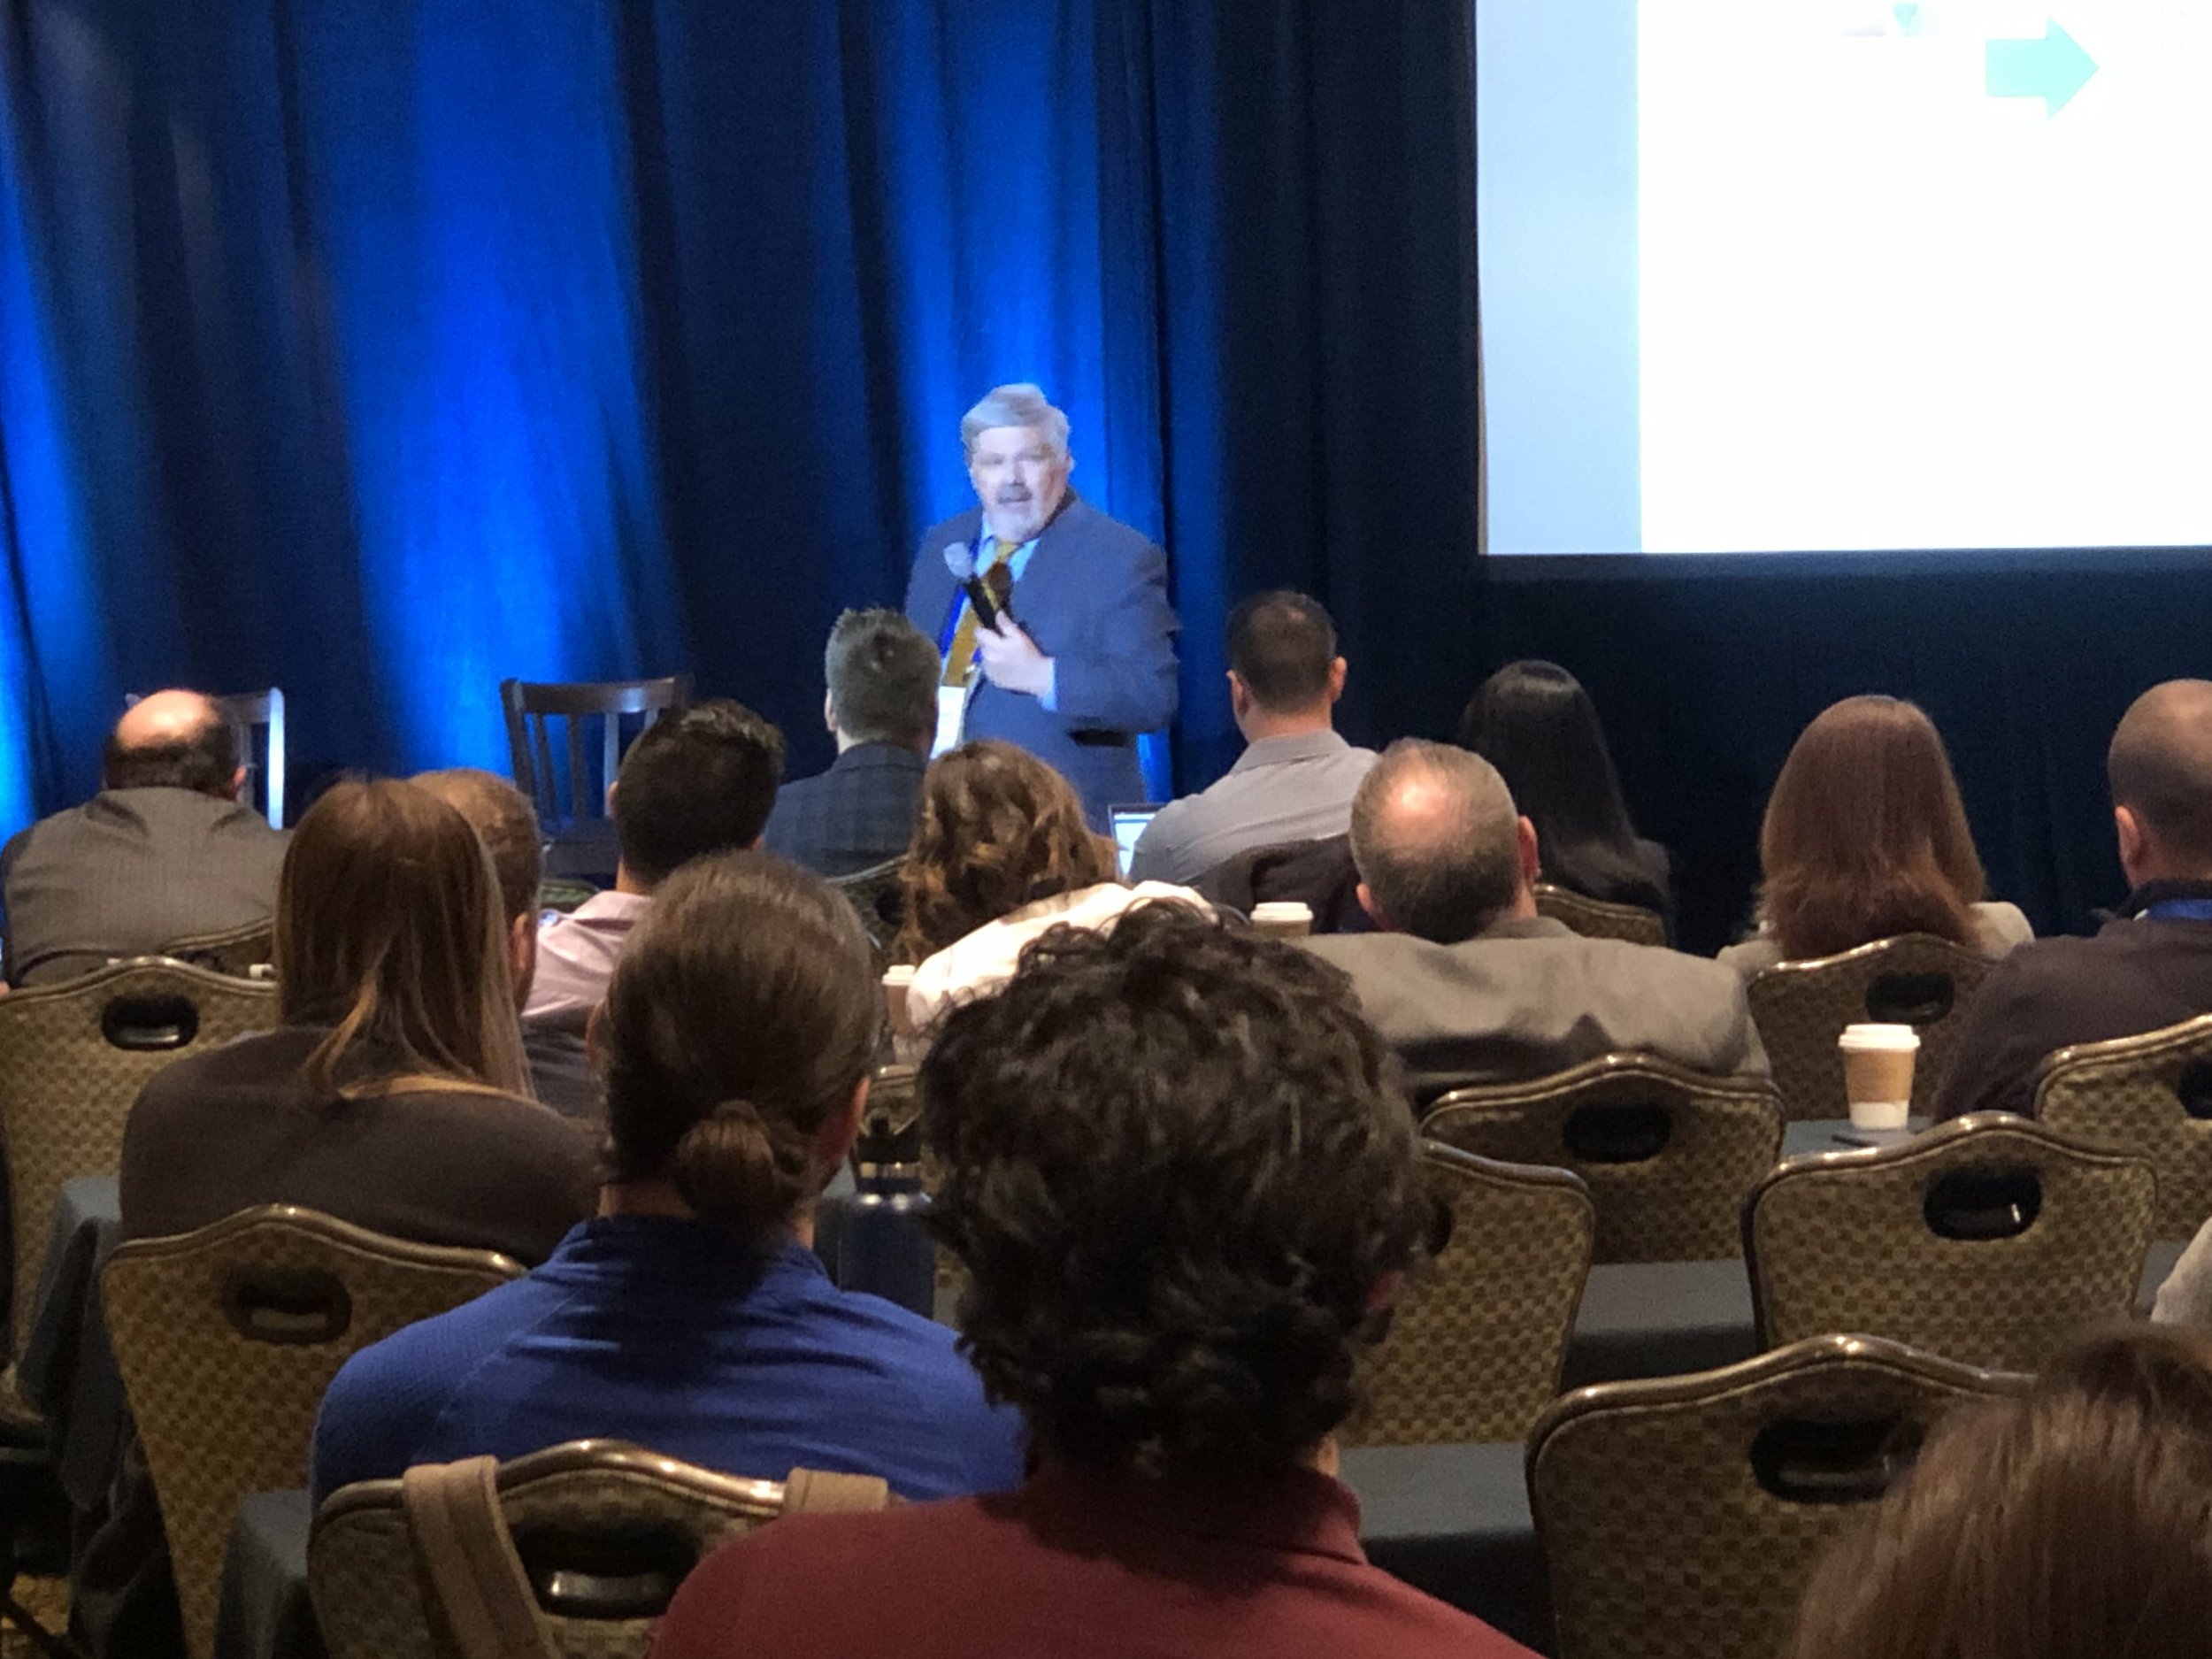
Keynotes


Case Study sessions


sponsored sessions


sponsors